
Extra Help
Visualise Missing with Missingno
Exploration and pre-processing of data is an important part of data science or machine learning workflow.
When working with training datasets, it is possible that they have been designed to be used and allows the algorithm to run successfully.
However, in the real world, data is
disorganized! It may contain incorrect values, incorrect labels, or
parts that are missing.
When working with real datasets, one of the most common issues is
missing data.
Data loss can occur due to a variety of factors, including sensor failure, data vintage, poor data management, and even human error.

Prior to further data analysis or machine learning, it is critical that missing data is recognized and dealt with appropriately.
Many machine learning techniques are incapable
of handling missing data as well as require entire rows containing a
single missing value to be deleted or replaced (imputed) with a new
value.
Depending on the data source, missing values may be represented in a
variety of ways.
The most common is NaN (Not a Number), but other variations include "NA," "None," and "-."
If the missing values in your dataframe is represented by more than just NaN, it should be converted to NaN using np.NaN, as shown below.
>>> df.replace('',np.NaN) |
The missingno Library
Missingno is a great Python module that provides a sequence of visualisations to help you to understand the existence and allocation of incomplete information inside a pandas dataframe.
It can be depicted by a barplot, matrix plot,
heatmap, as well as dendrogram.
We could indeed determine where missing values arise, the extensiveness
of the missingness, and if any of the incomplete data are found to
correlate with each other through these plots.
The pip command could be used to install the missingno repository from the anaconda command prompt of the usual command line:
>>> pip install missingno |
Here we will carry out this demonstration with a dataset you can download from here : Wisconsin dataset
However this is the original which i cleaned out a bit and ,for the sake of the demo, I also removed some values to show you guys the difference.

Download. Unmodified values.
The missing values dataset can be downloaded from the button below :
Download. Modified values
Codeblock E.1. Missingno package demonstration.
The Python module Missingno provides visualisations for comprehension of the distributed missing data within a pandas dataframe.
This can take the shape of a dendrogram, heatmap, barplot, or matrix plot.
We can determine the locations of missing data, their extent, and whether any of the missing values are associated with one another from these graphs.
Barplot
The barplot offers a straightforward plot in which each bar corresponds to a column of the dataframe.
How complete a column is, or how many non-null values are there, is indicated by the height of the bar. It can be produced by contacting:
>>> msno.bar(wisconsindataset) |
The y-axis scale on the left side of the plot runs from 0.0 to 1.0, with 1.0 denoting 100% data completeness. If the bar is lower than this, it means that there are blank values in that particular column.
The scale is represented on the plot's right side via index values. The maximum number of rows in the dataframe is shown on the upper right.
The total count of the non-null values in that column is shown as a sequence of numbers at the top of the plot.
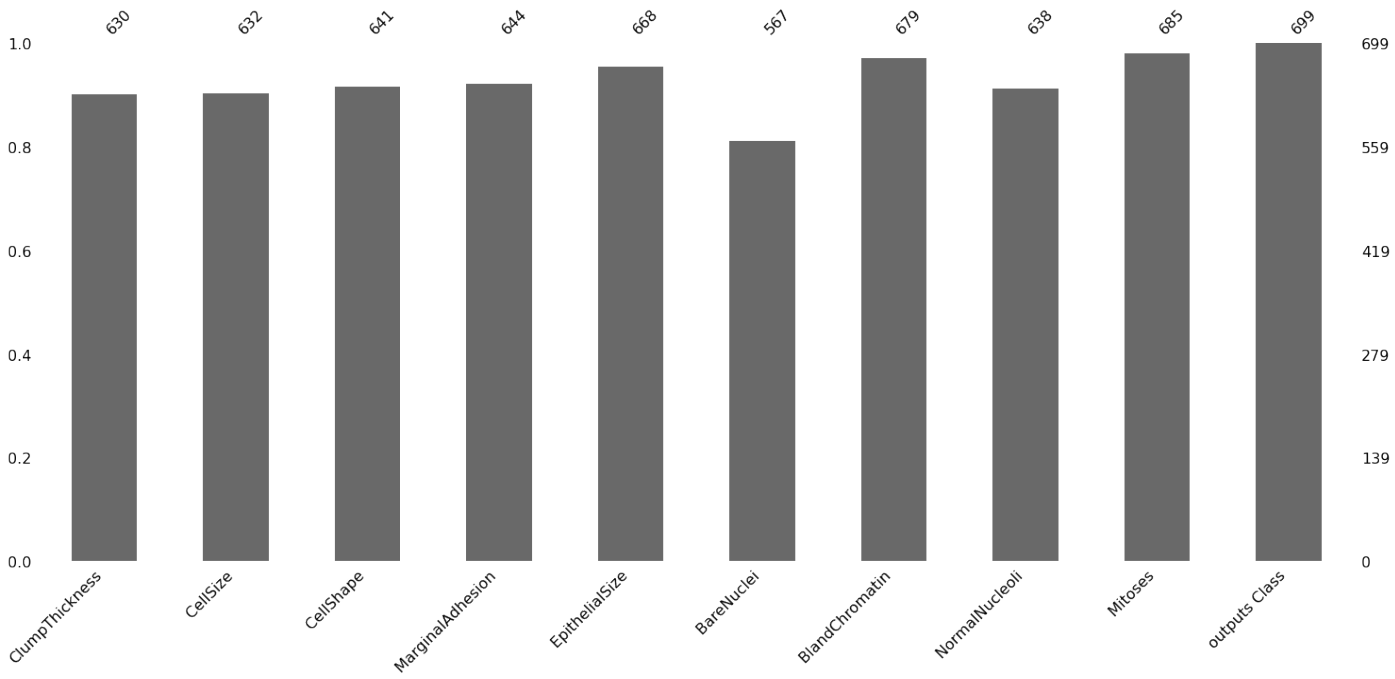
Figure E.1. Sample Barplot.
Matrix Plot
If you are working with depth-related or time-series data, the matrix plot is a useful tool.
>>> msno.matrix(wisconsindataset) |
Each column has a color fill provided. When there is data, the plot is shaded in grey (or another color of your choice), and when there is none, it is shown in white.
A sparkline that runs from 0 on the left to the entire number of columns in the dataframe on the right is shown on the right side of the display.
Above is a close-up image. When each column in a row contains a value, the line will be at its farthest right position.
The line will shift to the left when the number of missing data in that row starts to rise.
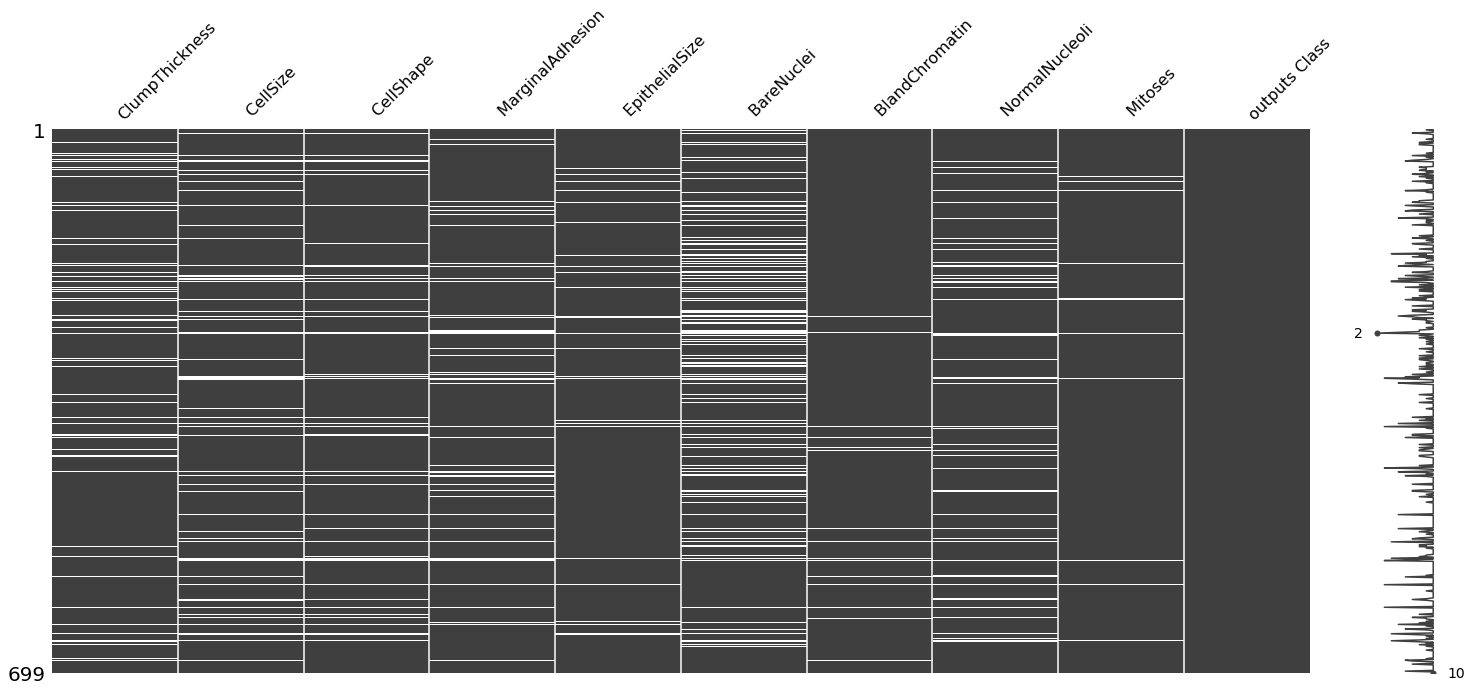
Figure E.2. Sample Matrixplot.
Heatmap
The correlations between the nullity in each of the several columns are found using the heatmap. This is used to determine if there is a relationship between each of the columns when null values are present.
The presence of null values in one column is connected with the presence of null values in another column, according to values that are close to positive 1.
Null values in one column are anti-correlated with null values in another column, according to values that are near to negative (-1) I.e. when one column contains null values, the other column contains data values, and vice versa.
Values that are very near '0' show that there is little to no correlation.
>>> msno.heatmap(wisconsindataset) |
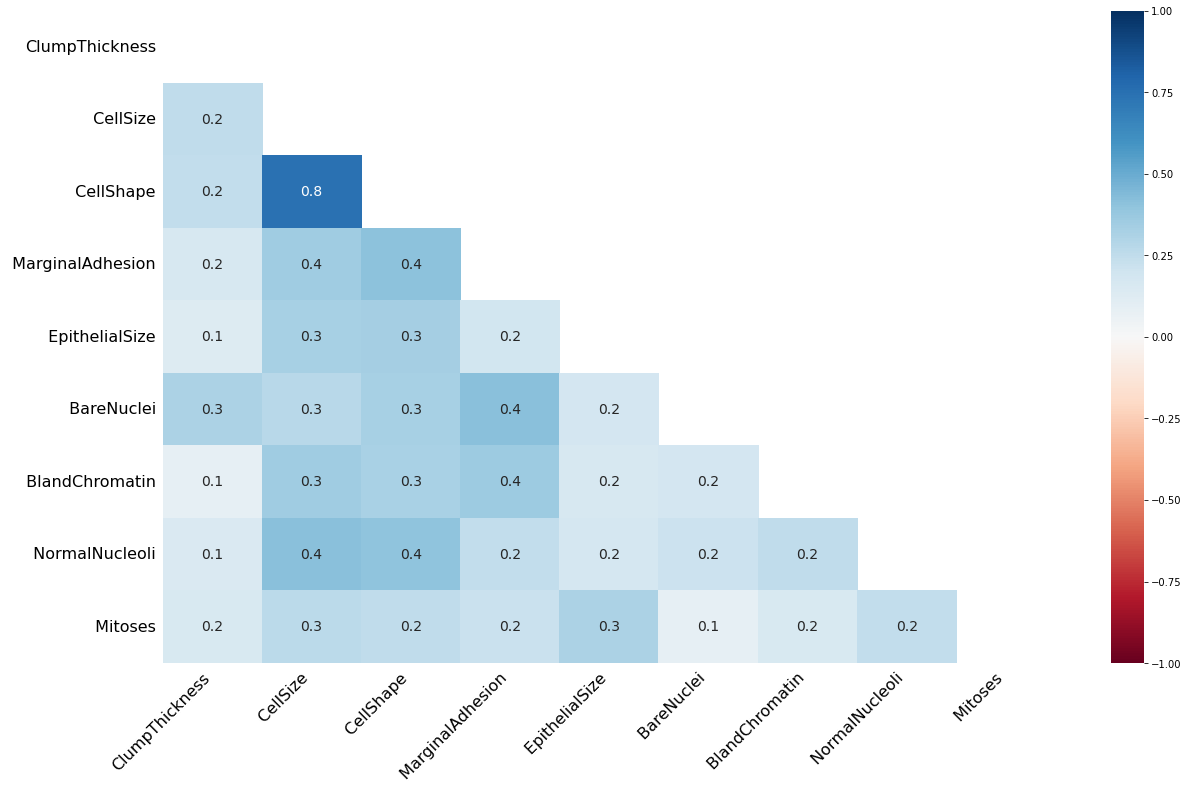
Figure E.3. Sample Heatmap.
Dendrogram
The dendrogram graphic unites columns with a high degree of nullity correlation into a tree-like network created via hierarchical clustering.
If several columns are grouped together at level zero, the presence or absence of nulls in any one of those columns will immediately affect the other columns.
The likelihood that null values can be connected between columns decreases with increasing column separation in the tree.
>>> msno.dendrogram(wisconsindataset) |
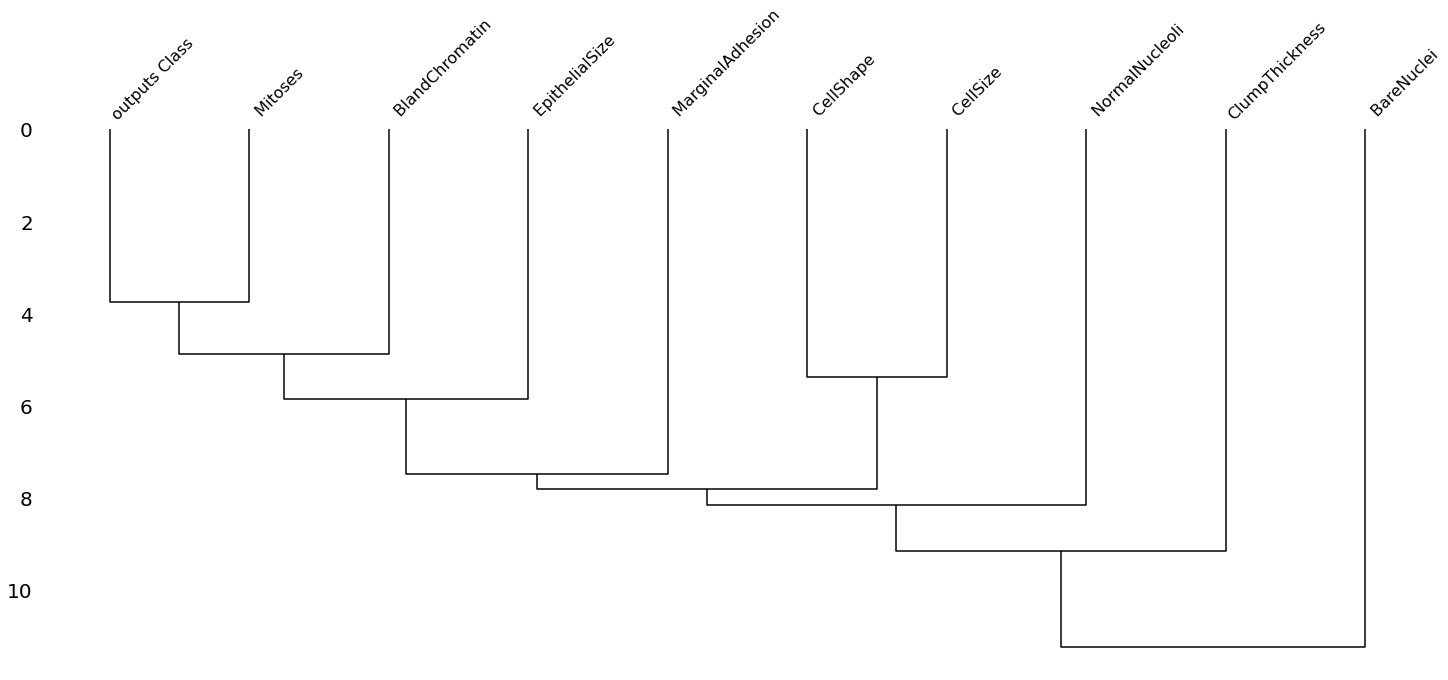
Figure E.4. Sample Dendogram.
---- Summary ----
Prior to using machine learning, identifying missing data is a crucial step in the data quality pipeline.
The missingno package and a number of visualizations can be used to accomplish this in order to comprehend the amount of missing data that is there, where it happens, and how the occurrence of missing values is associated between the various data columns.
What does Missingno package in python do ?
Missingno is a Python package that provides functions for visualizing missing data in pandas DataFrames.
________________________________________________________________________________________________________________________________

________________________________________________________________________________________________________________________________
Copyright © 2022-2023. Anoop Johny. All Rights Reserved.