
Molecular Modeling & Drug Discovery
5. Structure determination:
X-Ray crystallography structure determination
Protein X-ray crystallography is a method for determining a specific protein's three-dimensional structure using x-ray diffraction of its crystalline state.
The functionality of a protein is largely determined by its three-dimensional structure.the amino acids in a polypeptide chain to make proteins.
Nuclear Magnetic Resonance (NMR) and x-ray crystallography are two frequently used methods for analyzing the structure of proteins.
NMR is limited to biopolymers such as starch, peptides, and sugars with a molecular weight no greater than 30,000 (g/mol).
X-ray crystallography can be used to examine any various substances up to a molecular weight of 106 (g/mol).
A protein crystal, an x-ray source, and a detector are necessary for an X-ray crystallography analysis to be completed.
Crystallography method
Involves three steps
Step 1 :
A target protein is crystallized first in the procedure.
All of the protein atoms become fixedly oriented with respect to one another during protein crystallization while yet retaining their biologically functional conformations.
A protein needs to be extracted or precipitated out of a solution.
To crystallize proteins,
4 crucial processes must be
completed. These are:
Purification :
To determine the protein's purity, purify it.
Precipitation : Proteins are dissolved in a suitable solvent (water-buffer solution with organic salt such as 2-methyl-2,4-pentanediol or a detergent such as sodium lauryl sulfate added for intractable proteins) to precipitate the protein.
Supersaturation : Adding a salt to a concentrated protein solution causes supersaturation of the solution, which condenses the protein from the solvent by generating condensation nuclei, limiting solubility, and causing the development of an ordered crystal (salting out).
Crystal growth : Crystal growth involves the creation of crystal nuclei, which results in true crystal growth.
| Note |
| Recrystallization : |
| The process of recrystallization is crucial in the purification of chemicals. |
| To clean up the crystal lattice of impurities in this process, recrystallization is essential. |
| Finding a good solvent to work with, gravity filtration, slow cooling, and vacuum filtration are methods used in recrystallization. |
| A suitable solvent is essential for a successful recrystallization. |
| A solvent that will dissolve the sample at high temperatures but not at cool temperatures enabling the solute to precipitate at cool temperature opposed to when the sample dissolves at a warm temperature. |
| When the solute cools, a precipitate develops because the solute is only soluble in the warm solution. |
| Gravity filtering eliminates any remaining insoluble impurities before recrystallization, primarily for the filtration of color and charcoal impurities. |
| Gravity filtration is efficient, but in order to preserve pure crystals in the filter paper, crystallization must be avoided during the process. To guarantee crystal purity and size, slow cooling is necessary. |
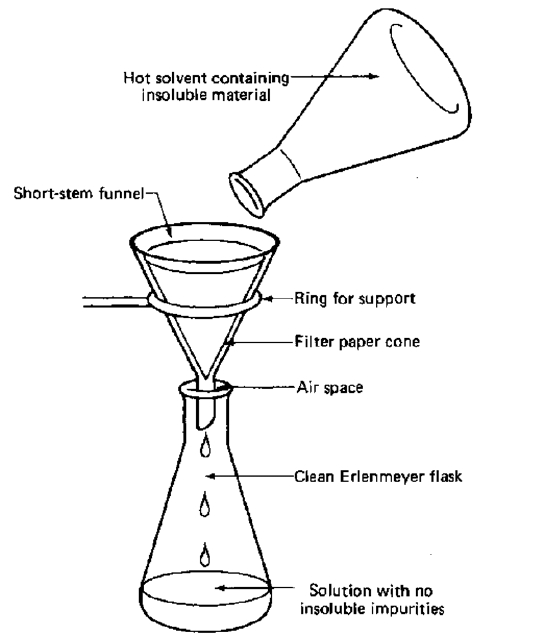 Figure 1. A typical gravity filteration setup. |
| Slow cooling allows the dissolved contaminants to interact with the solvent rather than being locked inside the crystal lattice. |
| Because crystallization happens too quickly during fast cooling, contaminants may be trapped in the crystal lattice and not have time to dissolve back into the solvent. |
| The solution is filtered by vacuum filtration to separate the pure crystals from the solution containing the contaminants after the crystals are placed in a cold bath to guarantee maximal recrystallization. |
| The clean crystals are collected and weighed after it has been vacuumed. |
Step 2 :
In the following stage, x-rays are produced and focused on the protein crystal.
There are four techniques to produce X-rays :
-
by directing a stream of extremely energetic electrons at a metal source.
-
involves subjecting a substance to a primary X-ray beam in order to produce a secondary X-ray fluorescence beam.
-
from an X-ray-producing radioactive decay process (Gamma rays are indistinguishable from X-rays).
-
from a synchrotron radiation source, which is a cyclotron with a steady electric field.
The protein crystal is then exposed to x-rays, some of which pass through it and the remainder of which disperse in different directions.
.png)
Figure 2. X-ray crystallography technique implementation.
"X-ray diffraction" is another name for x-ray scattering caused by the radiation's electric and magnetic fields interacting with the electrons in the crystal's atoms.
The Bragg's Law governed interference of the diffracted x-rays produces the patterns.
| Note |
| Bragg's Law : |
| nλ=2dsinθ |
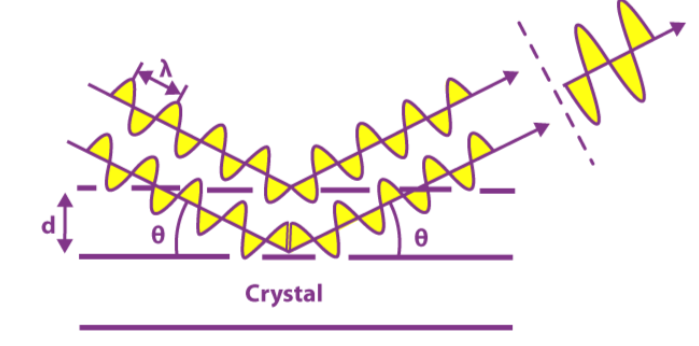 |
| Figure 3. Bragg's law diagrammatic depiction. |
where :
-
"n" is an integer.
-
"theta" is the angle of diffraction.
-
"lambda" is the wavelength of the diffracted x-ray.
-
"d" is the distance between two regions of electron density.
If the angle of reflection meets the prerequisite:
Positive interference will result from the diffracted x-rays. Otherwise, there is detrimental interference.
While destructive interference shows that the x-rays are not precisely in phase with each other.
constructive interference indicates that the diffracted x-rays are in phase or lined up with each other.
As a result, the angle and distance between the detector and the crystal affect how much radiation is measured to be there.
The approach is based on the following three fundamental physical principles:
-
Atoms disperse x-rays. The amount of electrons in the atom directly correlates with the amplitude of the diffracted x-ray.
-
Recombining waves are dispersed. If the beams are in phase, they reinforce one another at the film; if they are out of phase, they cancel one another out. Each atom adds to the scattered beam.
-
The recombination of the beams is controlled by the three-dimensional atomic configuration.
Thus, the primary experimental data for the analysis are the spot intensities and their locations.
On the basis of the observed intensities of the diffraction pattern on the film, the final step entails constructing an electron density map.
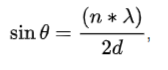
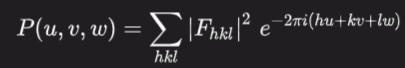
To reassemble the electron density distribution of the crystal, a Fourier Transform can be used on the intensities on the film.
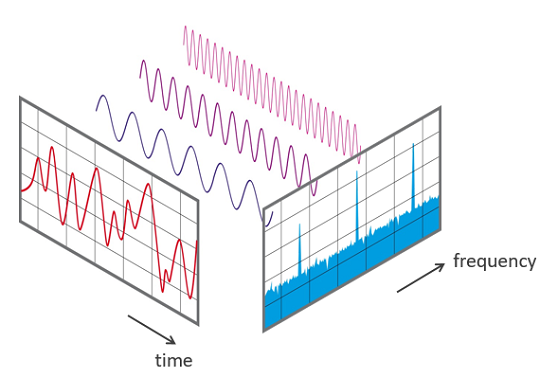
Figure 4. A Fourier transform is a mathematical transformation that separates functions based on either time or space into functions based either on frequency (temporal or spatial). Another name for the procedure is analysis.
The Fourier Transform in this instance uses the spatial configuration of the electron density to calculate the spatial frequency (how far apart the atoms are) and displays it as a diffraction pattern on the x-ray film.
The electron density distribution can be represented via the Fourier Transform as a collection of parallel shapes and lines stacked on top of one another (contour lines), much like a landscape map.
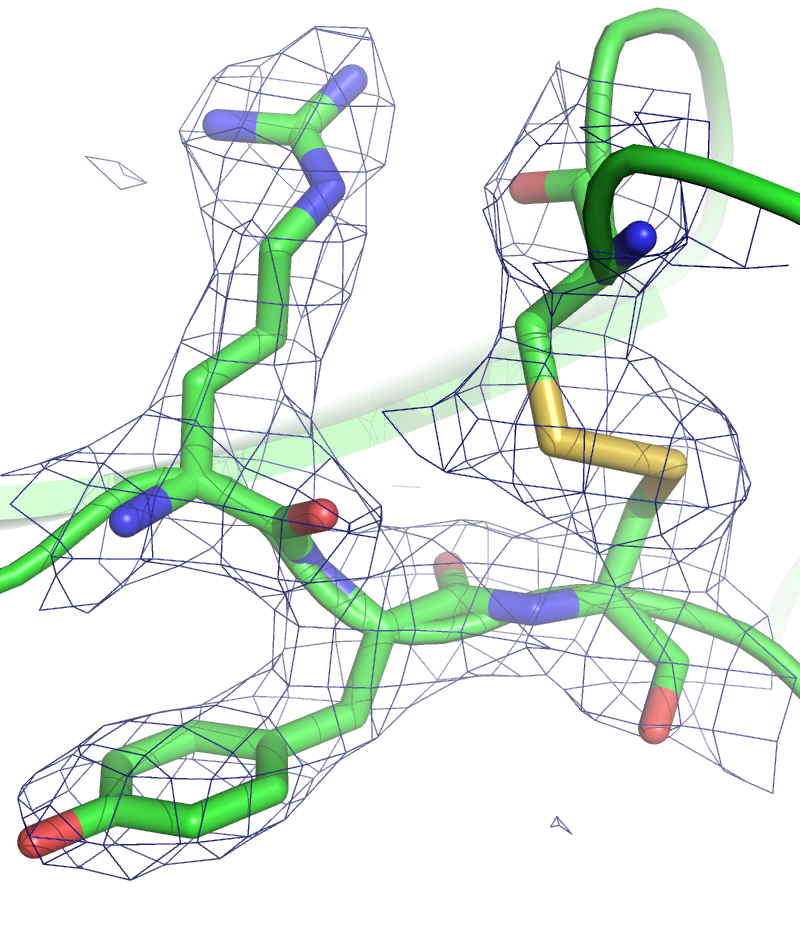
Figure 5. Typically how electron density maps are depicted for 3d drug molecules.
The mapping creates a three-dimensional image of the electron densities detected by x-ray crystallography.
Resolution must be considered while analyzing the electron density map.
-
The structure of polypeptide chains can be seen at resolutions between 5Å and 10Å.
-
Atomic groupings can be identified at resolutions of 3Å to 4Å.
-
Individual atoms can also be determined at a precision of 1.1Å to 1.5Å.
For proteins, the resolution is roughly 2Å and is constrained by the crystal structure.
X-ray crystallography has some benefits, including the ability to obtain an atomic-resolution structure even when the atomic structure is in solution.
Data collection
The Fourier transform of a structure is represented by the diffraction pattern of the object.
A model of the item will be produced via the difiraction's inverse Fourier transform.
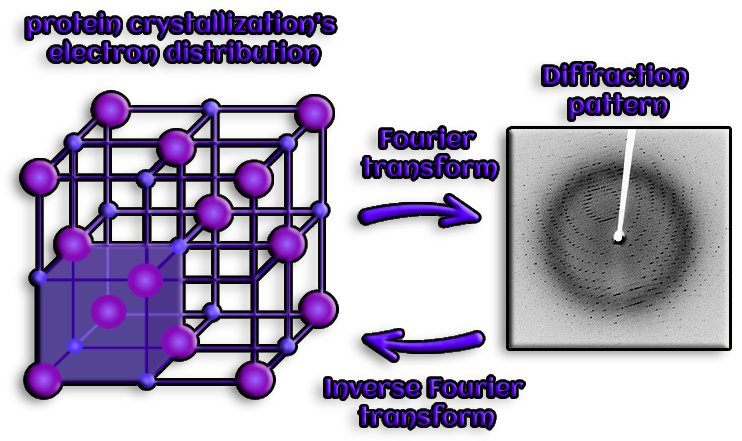
Figure 6. Protein crystallization is a crucial technique for demonstrating the chemical purity of proteins and for purifying them. This method is necessary for X-ray crystallography, a discipline that has made a significant contribution to our understanding of atomic and molecular structure, even at the level of proteins and nucleic acids.
To get diffraction that can be interpreted:
-
10^15 molecules.
-
Molecules with only a few or the same orientations.
-
Repeat in a systematic 3D manner.
Diffraction: The electromagnetic wave that a crystal scatters
The unit cell is the crystal's repeating unit.
The smallest part of a crystal structure to which symmetry operations can be applied to produce the entire unit cell is known as an asymmetric unit.
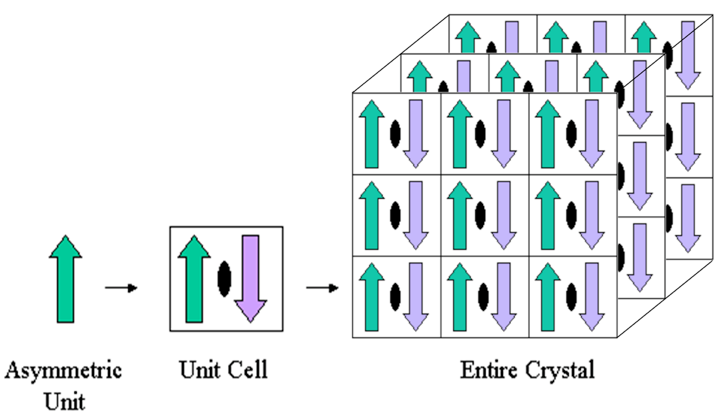
Figure 7. To create a second copy, the asymmetric unit (green upward arrow) is rotated 180 degrees around a two-fold crystallographic symmetry axis (black oval) (purple downward arrow). The unit cell is made up of the two arrows put together. To create a three-dimensional crystal, the unit cell is then translated three times.
The smallest component of a crystal structure to which symmetry operations can be done in order to produce the entire unit cell is called the asymmetric unit (the crystal repeating unit).
Rotations, translations, and screw axes are the symmetry operations that biological macromolecule crystals most frequently exhibit (combinations of rotation and translation).
One unit cell, produced by applying crystallographic symmetry operations to an asymmetric unit, can be translated into three dimensions to represent the entire crystal.
The special component of a crystal structure is
contained in the asymmetric unit. The crystallographer uses it to
fine-tune the coordinates of the structure in comparison to the
experimental data; it may not always be a complete assembly with
biological functionality.
An asymmetric crystal unit could include:
-
one biological combination.
-
a section of an organism's assembly.
-
a variety of biotic assemblages.
The position(s) and conformations of the crystallized molecule(s) within the unit cell determine the composition of the asymmetric unit. Two different scenarios may develop depending on the crystallization conditions and local packing:
-
Within a crystal unit cell, copies of the macromolecule or complex have the same conformations and are located in symmetry-related locations. As a result, the biological assembly can be made up of only one copy of the macromolecule or complex, or it can be made up of two or more larger assemblies that are made up of molecules or complexes with similar symmetry.
-
Copies of the complex or macromolecule adopt slightly different conformations and occupy distinct locations in the crystal's asymmetric unit. As a result, any one of the complex's various places may correspond to biological assemblies that are structurally related but not identical.
Resolution serves as a gauge for data quality. The diffraction pattern will reveal the intricate intricacies of the structure if the proteins are precisely aligned in the crystal.
.png)
Figure 8. The hydrogen atoms are not visible in the majority of protein structures that have been solved today because of the resolution, which ranges from 1.5 to 2.5 Angstroms, and there is some uncertainty in the precise location of the heavy atoms.
The amount of detail in the diffraction pattern as well as the level of detail that will be visible after the calculation of the electron density map are both measured as resolution.
Phasing
It is necessary to know the amplitude and phase of each scattered wave in order to deduce the molecular structure from a diffraction pattern (every reflection).
.png)
Figure 9. The interaction between the positions of the amplitude crests and troughs of two waveforms is known as phase. Phase can be quantified in terms of space, time, or angles. Two signals are said to be in phase when their peaks are precisely aligned at the same time and have the same frequency.
Amplitude is the square root of the measured reflection's intensity.
Phase: A diffraction experiment cannot measure it.
The phase problem is the potential loss of phase information that might happen during physical measurement.
In order to determine a structure from diffraction data in the discipline of X-ray crystallography, the phase problem must be solved.
.png)
Figure 10. With a probability proportional to the square of the wave's amplitude, photons reflect from the crystal in various directions. We lose all knowledge of the relative phases of the various diffractions when we count the photons.
The lost phases can be recovered in a number of
ways.
In x-ray crystallography, neutron crystallography, and electron
crystallography, the phase problem needs to be resolved.
Not every phase retrieval technique is compatible with the x-ray,
neutron, and electron wavelengths employed in crystallography.
Direct method
-
Direct methods can be used to estimate the first phases if the crystal diffracts with high resolution (1.2 ).
-
The Patterson approach, which uses the Patterson function to calculate the positions of heavy atoms directly, produces big values in locations corresponding to interatomic vectors.
-
Only when the crystal comprises heavy atoms or when a sizable portion of the structure is already known can this method be used.
-
If crystals offer reflections in the sub-ngström range, brute force approaches can be applied by experimenting with various phase values until spherical shapes are visible in the resulting electron density map.
-
Since "small molecules" and peptides offer high-quality diffraction with few reflections, the technique is constrained by processing power and data quality and is only applicable to these materials.
Atomic Replacement
-
The crystal of the relevant protein is used to measure the diffraction amplitudes.
-
The phases are "replaced" with ones calculated from a related (or identical) protein's previously established structure.
for instance, proteins linked to certain ligands
| Note |
| Atomic replacement |
| The known phases of a similar molecule are grafted onto the intensities of the present molecule, which are obtained by observation, in a technique known as molecular substitution. |
| These phases can be produced theoretically by modelling the molecule's packing in the crystal or experimentally from a homologous molecule if the phases are known for the same molecule in a different crystal. |
| These methods are often not preferred since they can significantly skew the structure's solution. |
| However, they are helpful for research on ligand interaction or between molecules with subtle variations and hard structures. |
Replacement of Single/Multiple Isomorphs
-
By interactions with amino acid side chains, for instance, heavy atoms (metal ions) are introduced to specific locations in the crystal lattice without affecting the unit cell.
-
Metal ion phases can be inferred from anomalously scattered metal ions.
Single Isomorphous replacement (SIR)
An early example of isomorphous replacement in
crystallography can be found in a 1927 study that reported the x-ray
crystal structures of several Cork-derived alum compounds.
The examined alum compounds had the general formula :
A.B.(SO4)2.12H2O
-
A denoted a monovalent metallic ion (NH4+, K+, Rb+, Cs+, or Tl+)
-
B denoted a trivalent metallic ion (Al3+, Cr3+, or Fe3+)
-
S denoted sulfur (may also denote selenium or tellurium)
When the heavy atoms were replaced, the alum crystals were mostly isomorphous, which allowed for isomorphous replacement to phase them. To determine the locations of the heavy atoms, Fourier analysis was applied.
Multiple Isomorphous replacement (MIR)
The process involves co-crystallizing with a heavy atom or soaking the crystal sample to be studied in a heavy atom solution. In this case, the structure shouldn't alter the crystal formation or unit cell dimensions in comparison to the native form; hence, they should be isomorphic.
Data sets from the sample's native and heavy-atom derivative are first gathered, and then the Patterson difference map is interpreted to determine where the heavy atom is located in the unit cell.
This makes it possible to determine the amplitude and phase of the heavy-atom contribution.
The phase of the native Fp and Fph vectors can be solved geometrically because the structural factor of the heavy atom derivative of the crystal (Fph) equals the vector sum of the single heavy atom (Fh) and the native crystal (Fp).
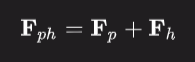
Figure 11. The mathematical description of how a material scatters incident radiation is known as the static structure factor, or simply structure factor. When interpreting scattering patterns (also known as interference patterns) from X-ray, electron, and neutron diffraction experiments, the structure factor is a vital tool.
Since employing just one will result in two potential phases, it is necessary to analyze at least two isomorphous derivatives.
Patterson function :
When performing X-ray crystallography, the phase problem is resolved using the Patterson function. While working as a guest researcher in Bertram Eugene Warren's group at MIT in 1935, Arthur Lindo Patterson presented it.
The definition of the Patterson function is :
Instead of the structure factors, it is effectively the intensities' Fourier transform. Additionally, the electron density convolved with its inverse is equivalent to the Patterson function:

In addition, the number of peaks on a Patterson map of N points, omitting the central peak and any overlaps, is N(N 1).
The interatomic distance vectors are the positions of the peaks in the Patterson function, and the peak heights are proportional to the product of the number of electrons in the corresponding atoms.
The Patterson function is always centrosymmetric because for every vector between atoms I and j, there is an oppositely oriented vector of the same length (between atoms j and i)
Interpretation of electron density :
A diffraction study's objective outcome is an electron density map.
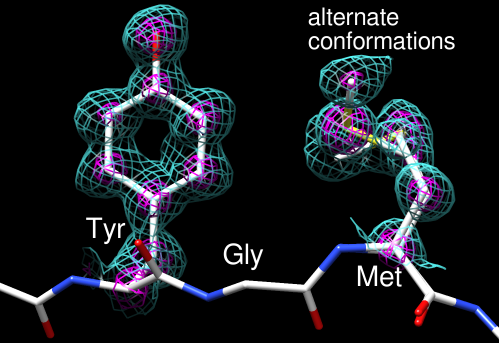
Figure 12. The end result of an X-ray structural determination is an electron density map. The maps reflect the degree to which the structural model fits the empirically obtained data.
The construction of the atomic model is more arbitrary.
The average of any place over all the unit cells of the crystal is referred to as electron density.
The exact alignment of all the molecules and all of their components is necessary for a sharp electron density (residues, atoms).
Problems:
-
Hydrogens are typically undetectable.
-
There may be more than one conformation for a polypeptide side chain or stretch.
-
If the number of conformations is big (>2), it will be impossible to identify the electron density.
-
A ligand's electron density will be low if it cannot bind all of the proteins in the crystal.
Occupancy
Indicate the percentage of molecules in each of the conformations using occupancy.
For each atom, two (or more) records are included, with occupancy values such as 0.5 and 0.5, 0.4 and 0.6, or other fractional values that add up to 1.
B-Factor
Spread of the electron density as a result of various conformations, often known as the temperature factor or B-factor.
The B- factor increases as the spread does. (Typically 20Å–30Å).
Refinement
Structure refinement is achieved through statistical adjustment of the atomic coordinates to fit the diffraction data better.
-
Match the model and the electron density
-
Calculate fit
-
Refinement of the model (with stereochemical restraints)
-
Repeat until convergence
R value
R factor is a way to measure the discrepancy between the model and the experiment.
the degree to which the calculated and observed amplitudes diverge.
R factor is typically between 15% and 20% (0.15 to 0.20) for data between 1.8 and 1.5 A.
This indicates that the model has captured about 80% of the measured scattering.
Free R factor
Comparable to how the work R factor is calculated
Uses a small fraction (5–10%) of randomly chosen reflections that were not included in the structural model's refinement.
Checks the model's accuracy in predicting experimental results that weren't used to create the model in the first place.
Typically, the free R factor is 3-5% larger than the work R factor.
Water molecules
.png)
Figure 13. The molecules of water slow down as the temperature drops, eventually slowing down to a point where hydrogen bonds can form and keep the water molecules together in a crystal lattice.
Between the proteins stacked in a crystal are solvent channels :
-
Atoms of water.
-
Components of the crystallization buffer.
How are water molecules arranged?
-
Locate electron density properties that the protein does not account for.
-
Ions like Na* or NH4+ may also be present.
The quality of the data will determine how well you can detect water molecules (resolution)
It is simpler to recognize water molecules that are bound to the protein's active site.
For a large number of water molecules to be placed, a resolution better than 2 A is often needed.
-
The shape of the amino acids
-
Primary structures (atom-to-atom distances, angles)
-
Bond durations
-
Angles of dihedral (Ramachandran plot)
-
Known exceptions include Gly and Pro.
Other residues for structures with high resolution could not fall within the predicted range.
water in molecules diagram:>
Methods for choosing a crystal structure involve some basic principles:
-
Resolution : 2A
-
20% R-factor or less (0.2)
PDB structures : Adenosine
receptor A2a
PDB code: 3EML
Experimental Data Snapshot
Method: X-RAY DIFFRACTION
Resolution: 2.6 A
R-value Free: 0.231
R-Value Work: 0.196
Release: 2008
PDB code: 4ElY
Experimental Data Snapshot
Method: X-RAY DIFFRACTION
Resolution: 1.8 A
R-Value Free: 0.213
R-Value Work: 0.174
Release: 2012
---- Summary ----
As of now you know all basics of Fold Structures.
-
Domains and motif.
-
Various secondary structure motifs.
-
SCOP.
-
CATH.
-
etc..
________________________________________________________________________________________________________________________________

________________________________________________________________________________________________________________________________